Shipping Performance,
in One View
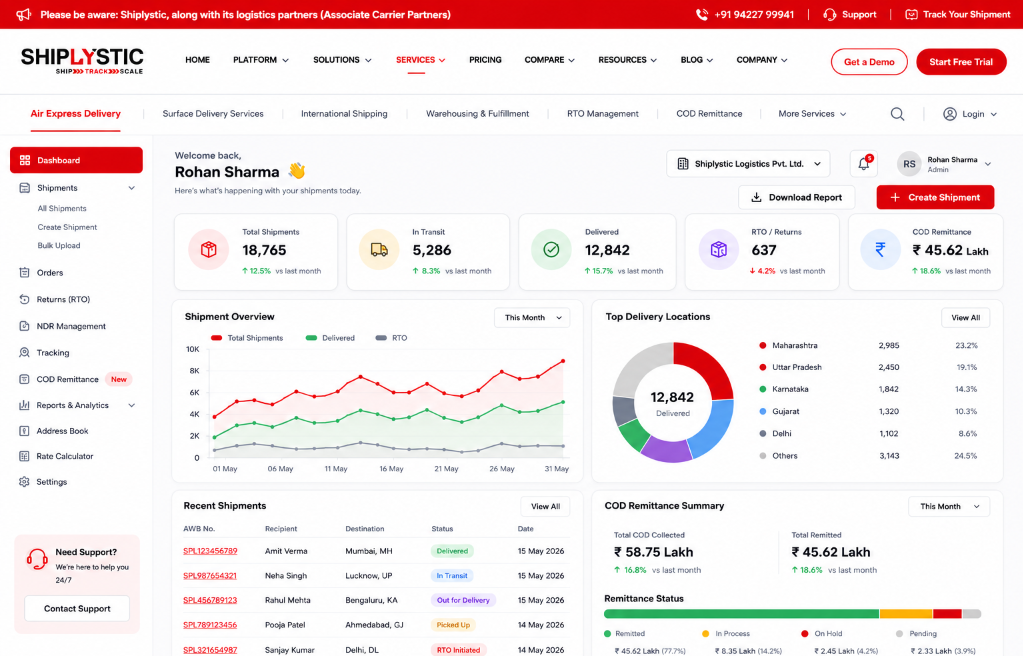
Courier performance, RTO patterns, COD reconciliation status, delivery timelines, and cost trends — all in one place, automatically. No more manually building reports from scattered courier portals.
What It Does
Clock Dial Showcase — Auto-rotating features around the platform core.
Courier Performance Comparison
Delivery success rate, average delivery time, and RTO rate broken down by courier partner — so you can see which partners are actually performing versus which ones only look competitive on paper.
SLA & Success RatesShipping Cost & Freight Spend Analytics
Cost trends by zone, courier, and shipment type — surfacing where spend is concentrated and where rate comparison is saving (or could save) money across your shipment mix.
Zone Spend OptimizationRTO and NDR Trend Reporting
Track return rates and delivery exceptions over time, by region, courier, or product category — identifying where intervention is needed before it compounds into a margin problem.
Exception InterventionCOD Remittance & Reconciliation Summary
Remittance status and discrepancy trends sit alongside the detailed COD Management view — so your finance team has both the summary and the drill-down in one place.
Finance Remittance LogCustom Date Segmenting & Exportable Reports
Slice performance data by time period, warehouse, courier, or channel to answer specific operational questions and pull data out for board decks or finance reviews.
CSV / PDF ExportWhy It Matters
Decisions about which couriers to prioritize, where RTO rate needs attention, or whether shipping costs are trending in the right direction all depend on having reliable, current data.
Building that manually from multiple courier portals is slow enough that most businesses only do it occasionally — if at all. Analytics Dashboards make that data available continuously, so decisions are based on what's actually happening, not a quarterly spreadsheet exercise.
When performance data is visible continuously, you can catch a deteriorating courier before it affects your NPS, catch an RTO spike before it destroys a month's margin, and catch a cost creep before it's normalized into your unit economics.
Without Analytics Dashboards vs. With
-
Courier performance only reviewed when something breaks — by then, customer complaints are already in.
-
Delivery rate and RTO trends visible week-over-week — catch issues before they compound.
-
Shipping cost creep unnoticed until finance does a quarterly audit.
-
Cost trends by zone and courier visible in real time — act on them while it still matters.
-
COD reconciliation requires manual cross-referencing of multiple courier remittance statements.
-
COD status and discrepancy trends in one view, alongside full remittance detail.
How It Works
Data flows in automatically — you just filter, read, and act.
Data Streams In Automatically
Every shipment event, courier interaction, COD collection, and NDR case across the platform feeds into your analytics view — no manual data entry or report scheduling required.
Dashboards Update in Real Time
Performance data reflects current operations without manual refresh — so what you see when you open the dashboard is actually what's happening now, not last week's export.
Filter to Answer Specific Questions
Slice data by date range, courier, warehouse, or sales channel to answer specific operational or strategic questions — without being limited to predefined report templates.
Export When You Need It Elsewhere
Pull data into your preferred format for board reporting, finance review, or external analysis — so analytics aren't locked inside the platform when stakeholders need them.
All Your Data. One Place.
Courier portals, COD statements, NDR logs, and zone cost data — all consolidated automatically so you never build a shipping report from scratch again.
Who This Is For
Built for every stakeholder who needs to understand what's happening across your logistics operation.
Operations Teams
Identify underperforming couriers or regions quickly — before service failures reach your customers or your returns rate spikes.
Finance Teams
Track shipping cost trends and COD reconciliation together — so cost analysis and payout tracking aren't split across different tools.
Founders & Leadership
Get a real-time view of logistics performance without waiting on manually compiled reports — always know where your operation stands.
Enterprise & 3PLs
Manage performance across multiple brands, warehouses, or business units — with the filtering granularity to separate each one cleanly.
Frequently Asked Questions
How the dashboards work, what's available today, and how your data gets there.
How current is the data shown in the dashboards — real time, or updated periodically?
Can I create custom reports, or only use the pre-built dashboard views?
Can I export analytics data for use outside the platform?
Are COD analytics separate from shipment delivery analytics, or in the same view?
Can I filter analytics by individual courier partner to compare performance?
Make shipping decisions based on real performance data,
not guesswork.
See what Shiplystic's Analytics Dashboards look like with your own shipment data — book a demo or talk to our team.